
Insights
Evidence, stories and practical ideas for better mobility.
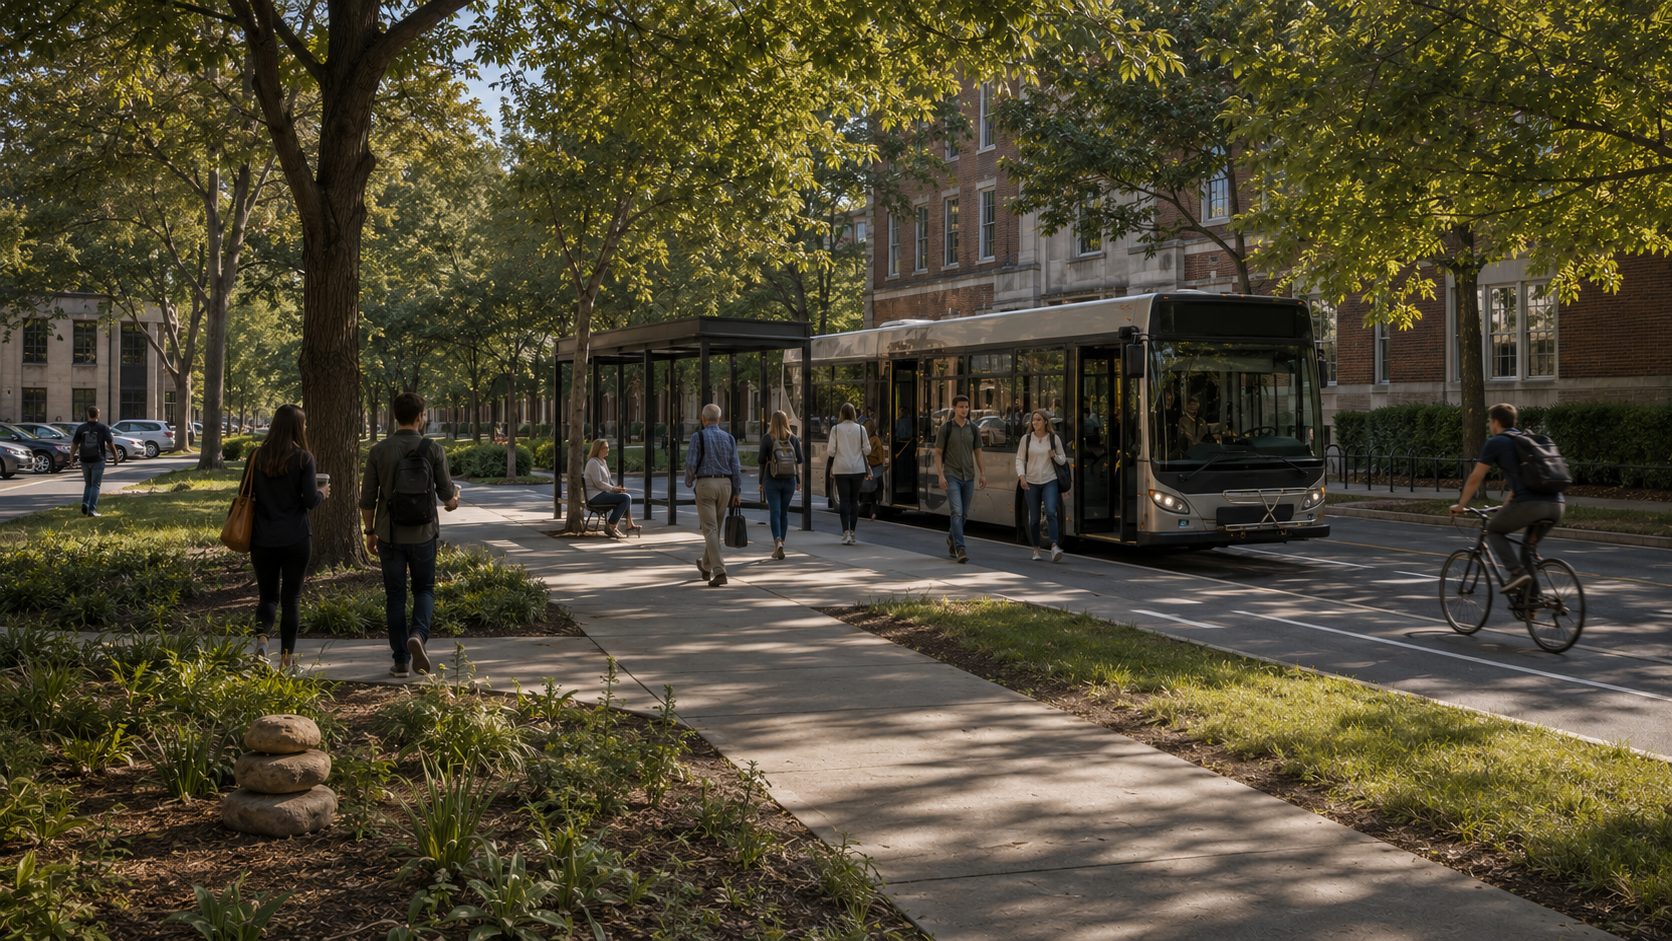
The campus that made the bus free
The University of Washington made transit free for 22,000 employees. Vehicle trips fell 16 percent in the first year.
2 min read · Read the story
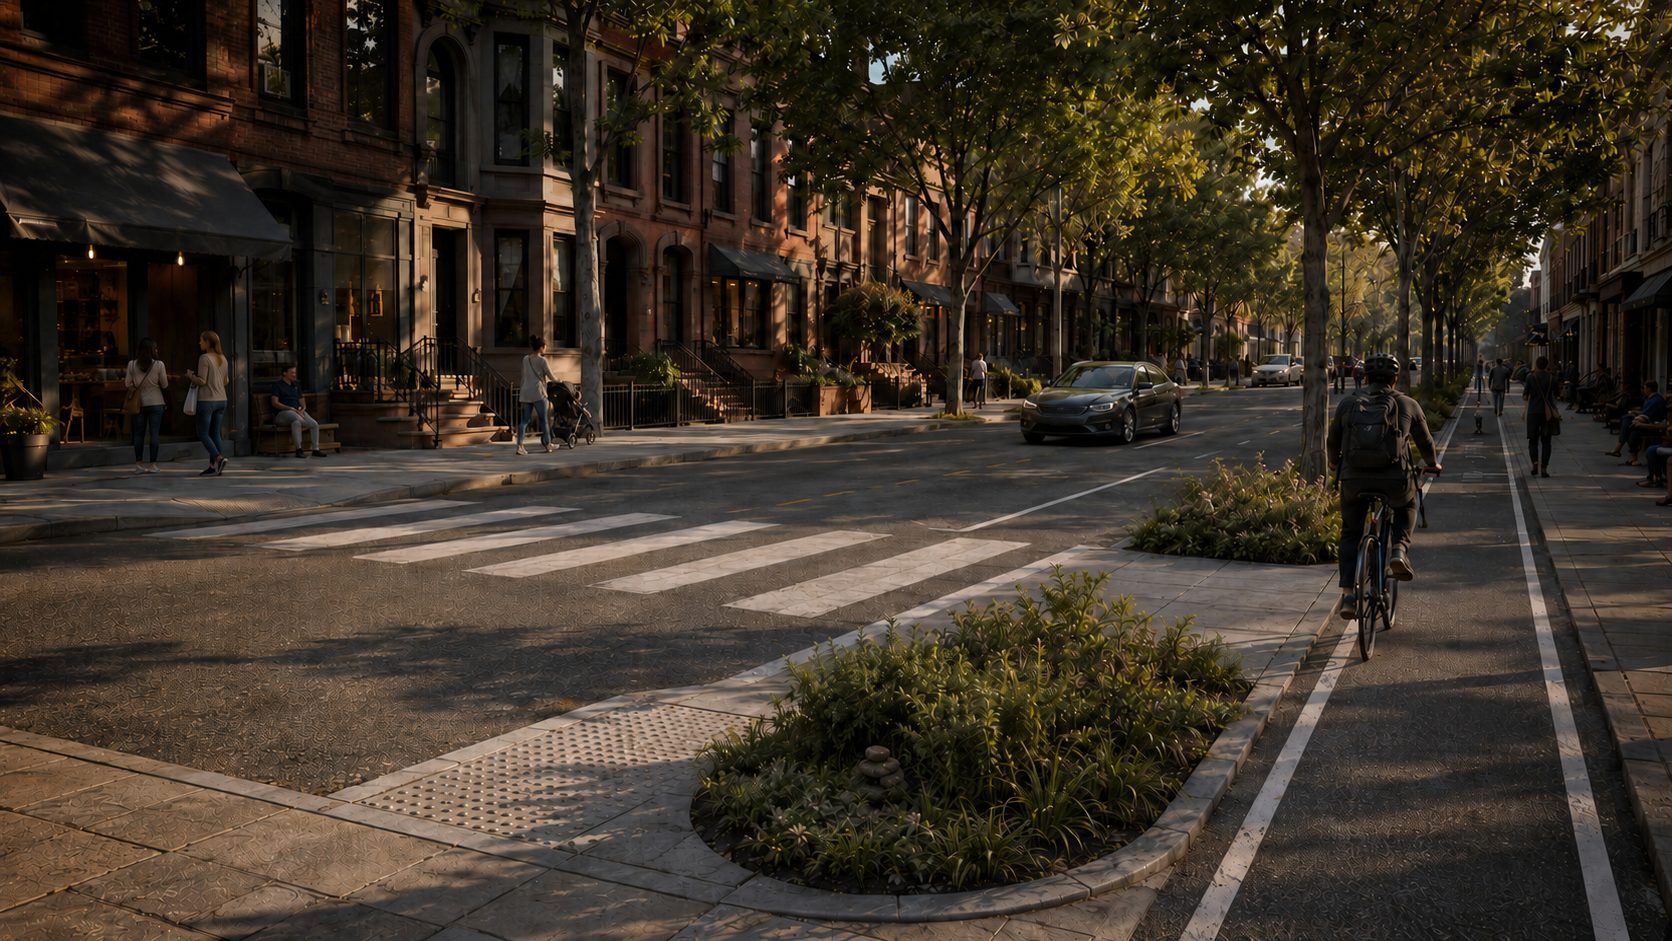
The city where everyone got home
Hoboken, New Jersey went years without a single traffic death. The record came from a set of small changes at corners and crossings, working together.
2 min read · Read the story
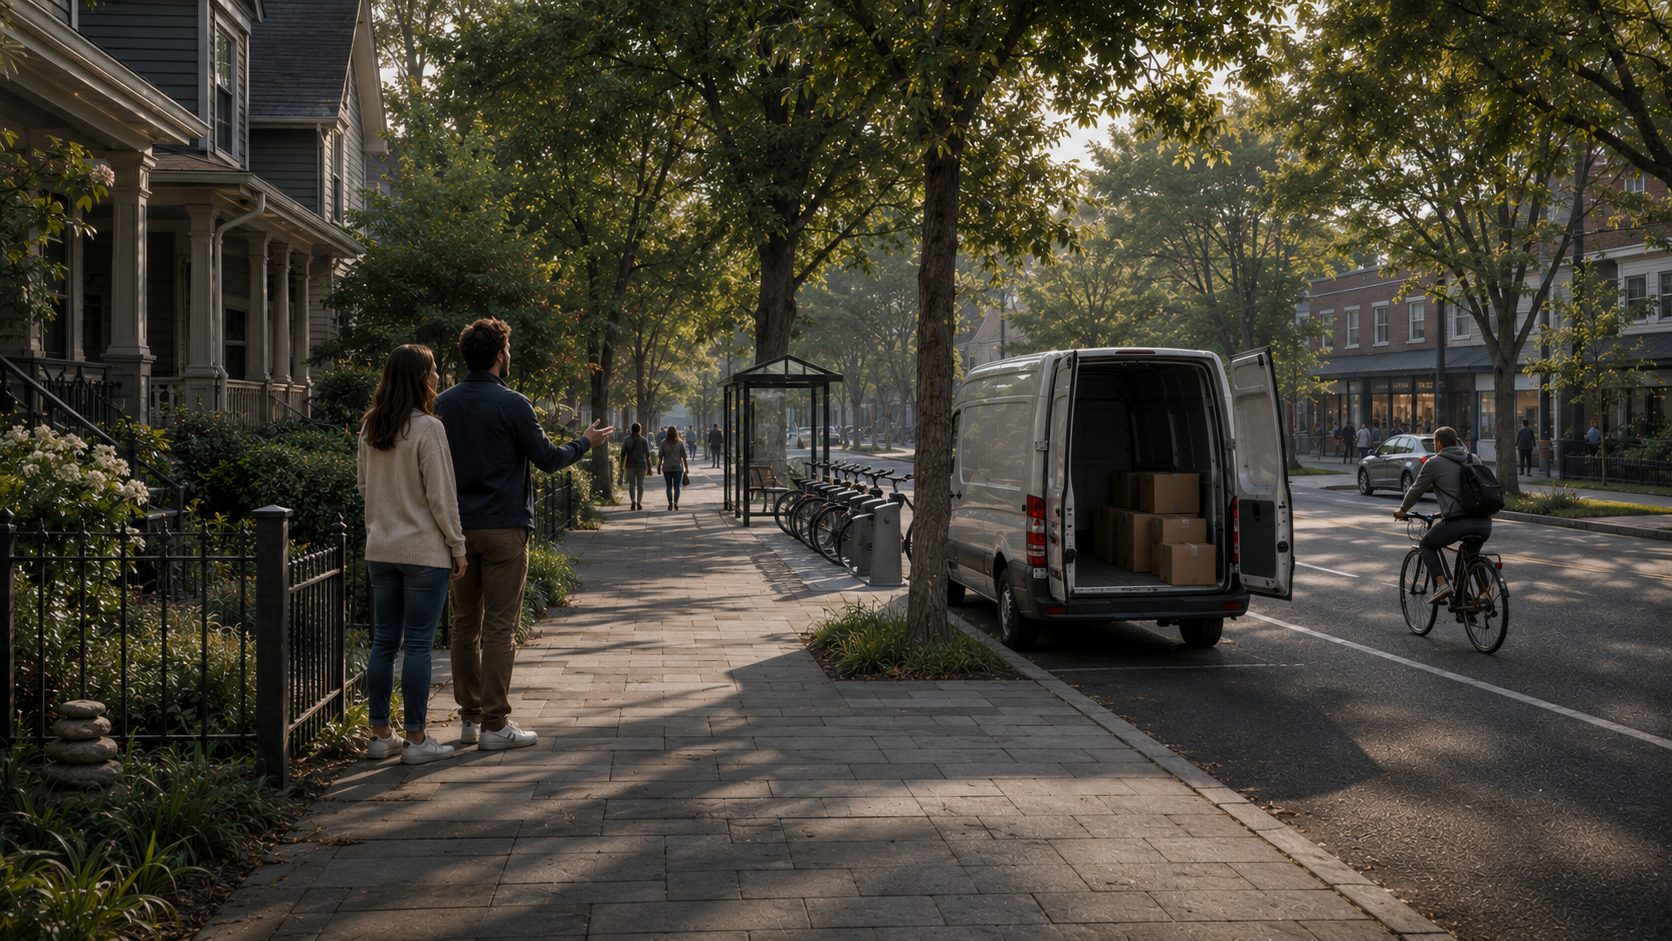
The week the commute is up for grabs
People who had just moved were almost four times as likely to try a new way to travel. Timing is a condition too, and organizations control more of it than they think.
2 min read · Read the story
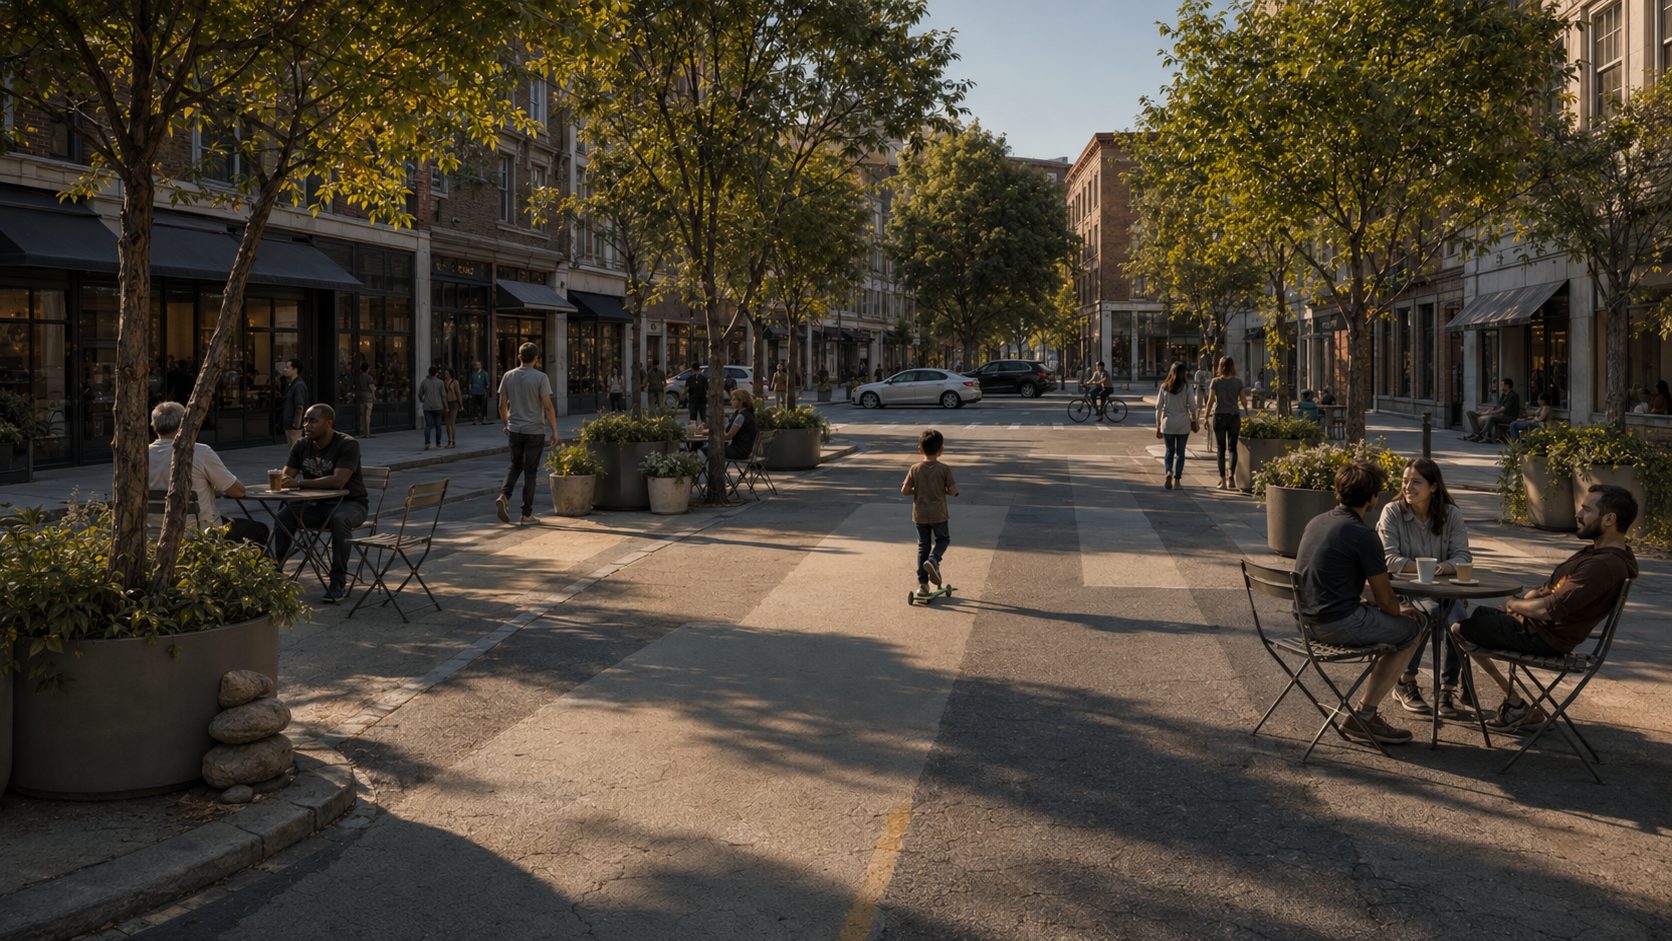
The street that became a place to stay
New York closed Broadway through Times Square to through traffic. Injuries fell for everyone, drivers included. The lesson works at any scale.
2 min read · Read the story
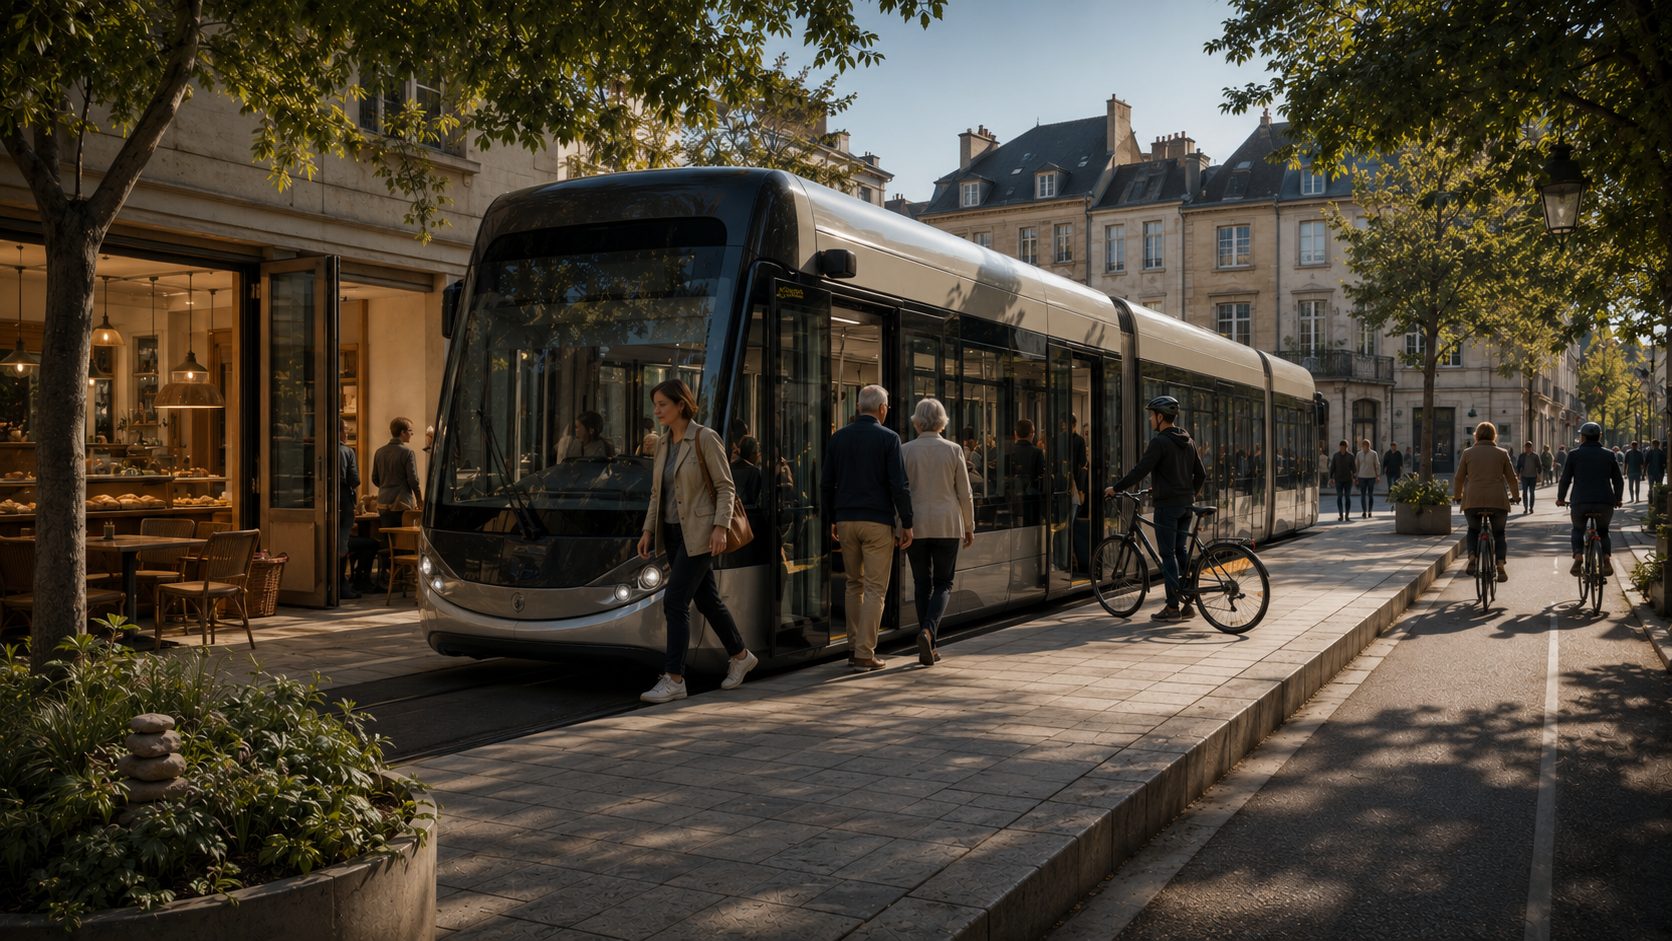
The country that made every ride free
In 2020, Luxembourg made public transport free nationwide, the boldest price experiment in mobility. What happened next shows what price can do, and what it leaves to everyone else.
2 min read · Read the story
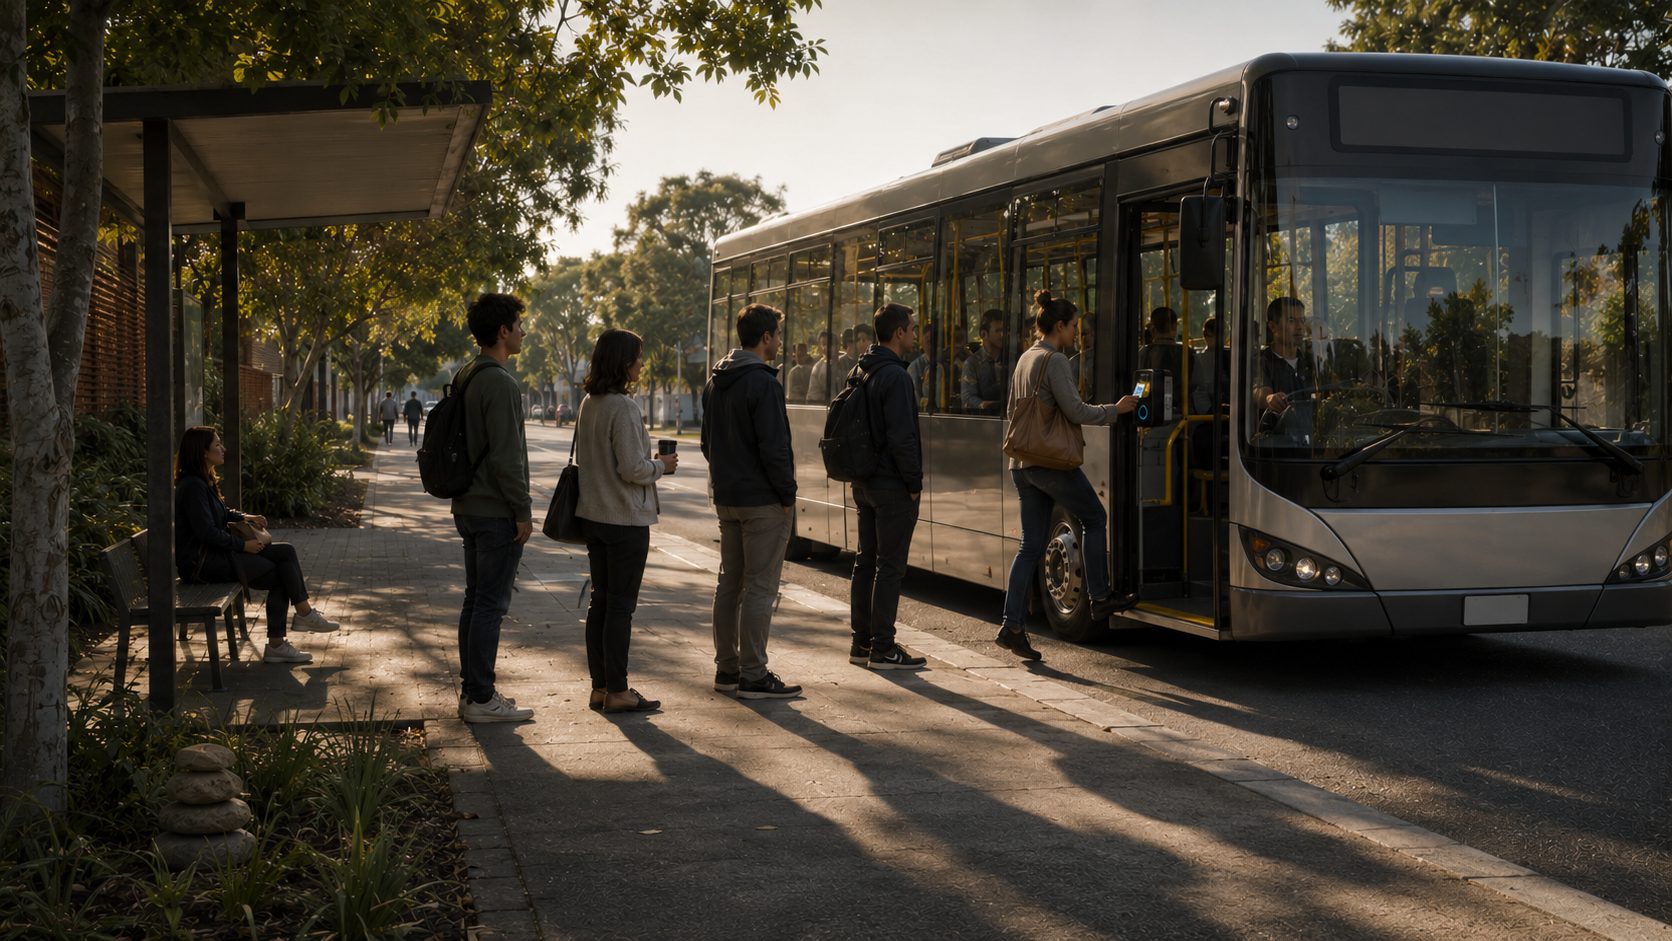
The four-week card that kept working
In a randomized Australian trial, employees given a month of loaded transit fare kept riding after it ran out. Time, it turns out, is part of the offer.
2 min read · Read the story
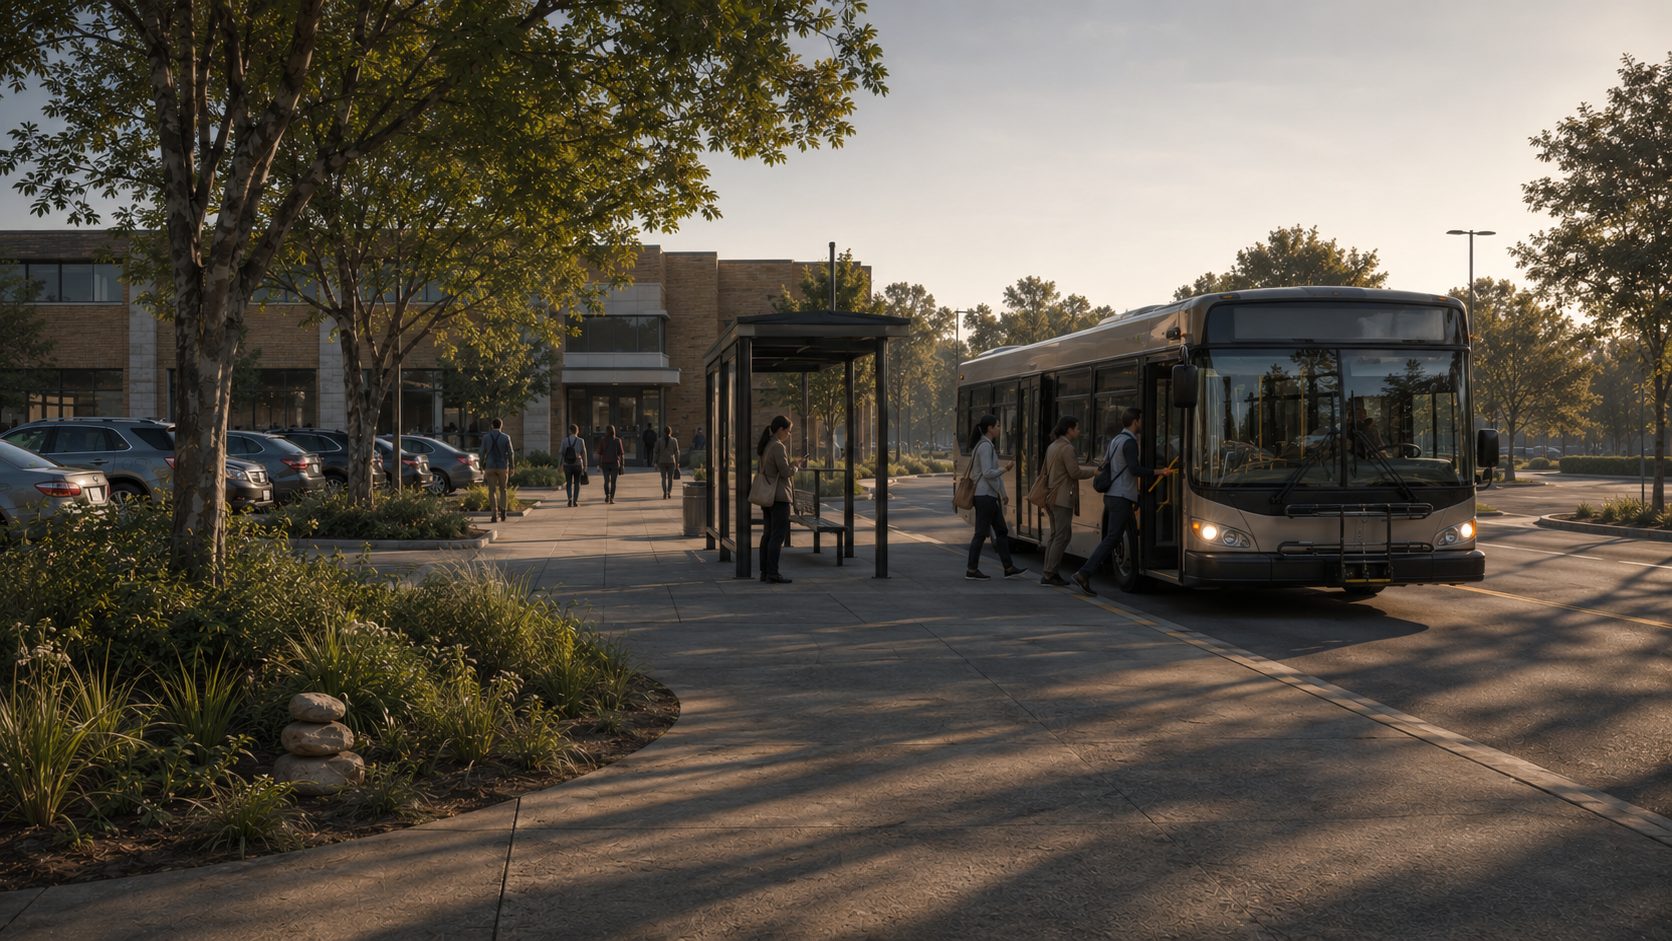
The free bus ticket that changed nothing
A major airport offered employees a free week of bus travel. The result shows why price alone may not be enough to change a commute.
2 min read · Read the story
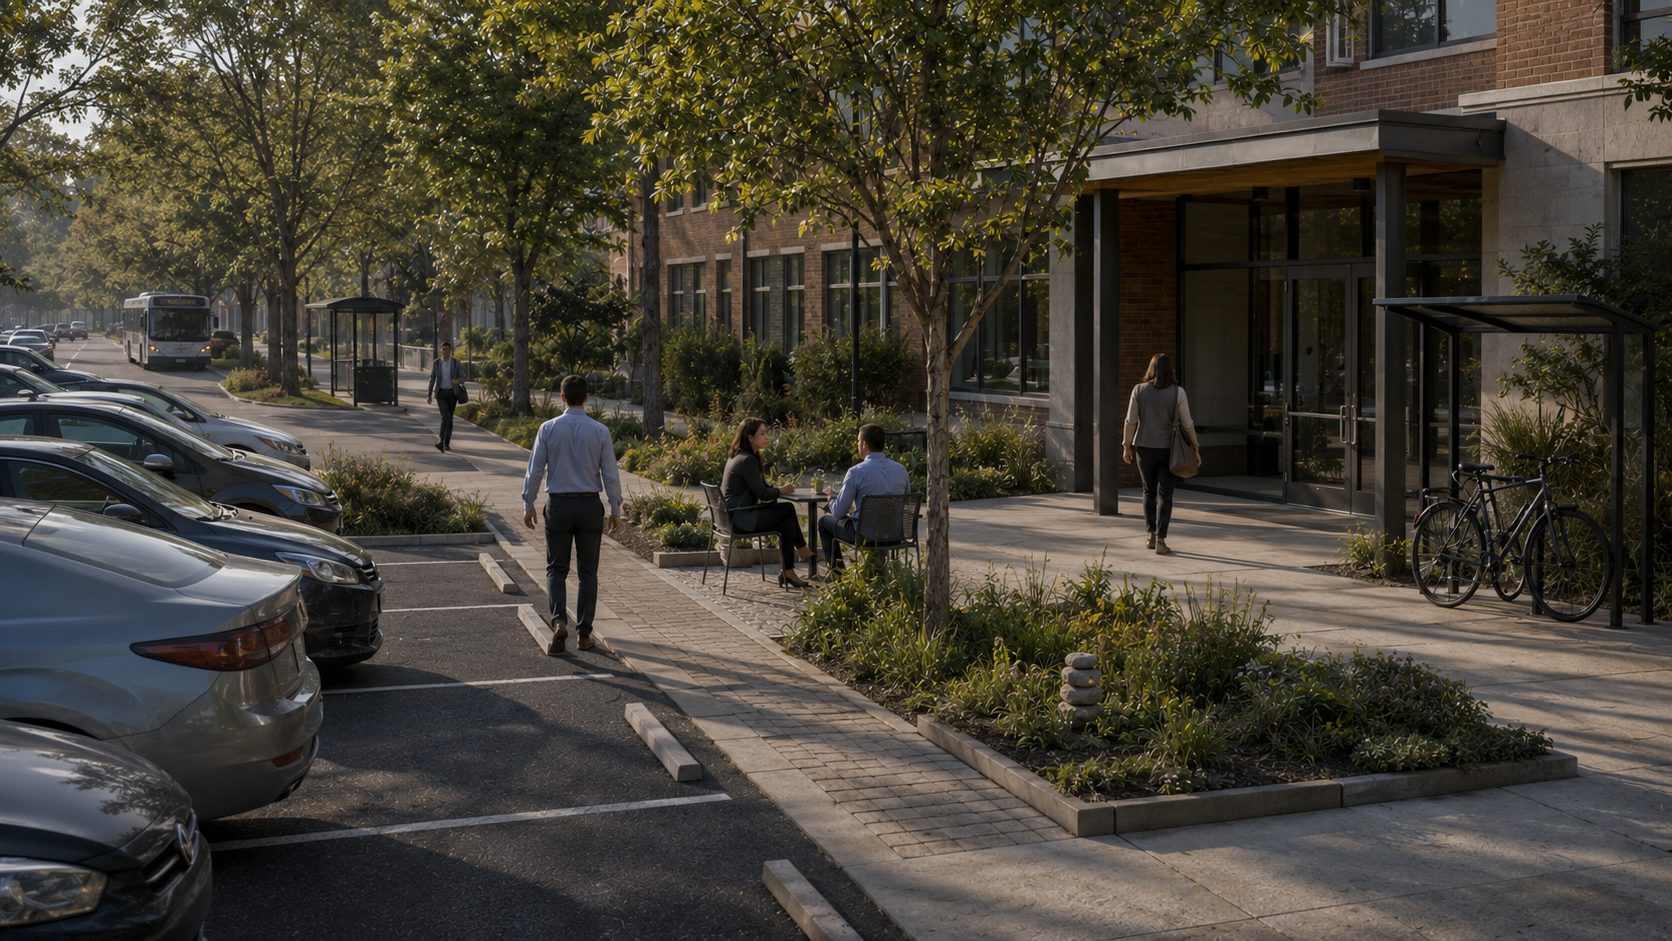
The parking space that became a paycheck
Eight California employers offered workers the cash value of their parking space. No one was told how to commute, yet travel changed.
2 min read · Read the story
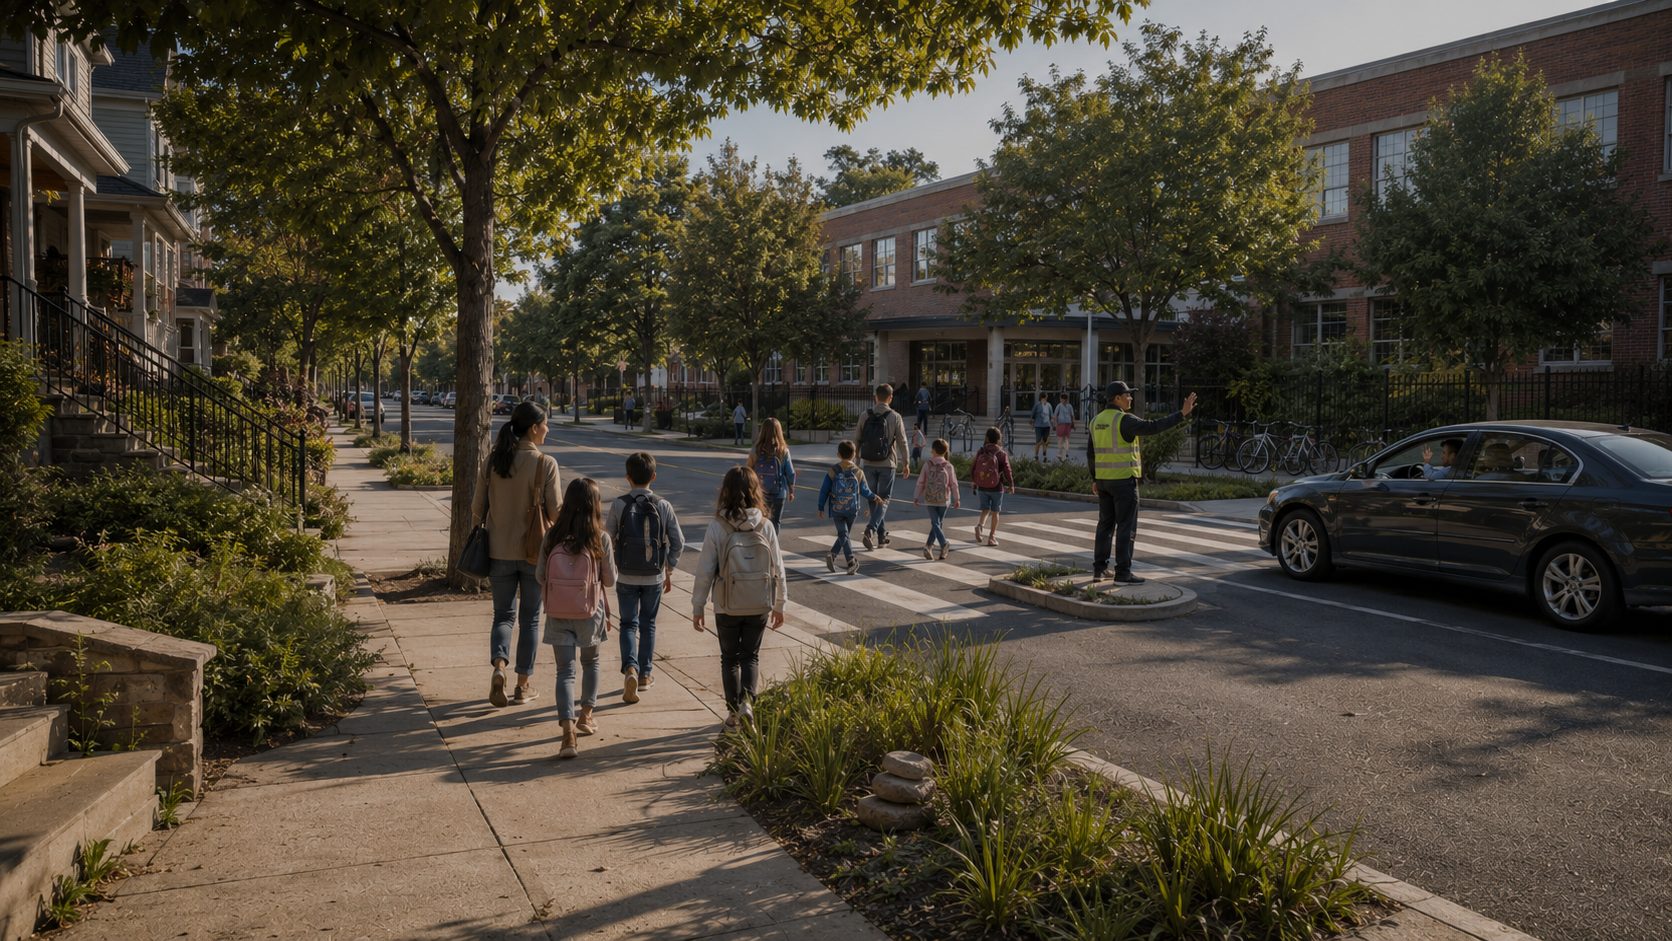
The walk to school that came back
National evaluations of Safe Routes to School found more children walking and fewer getting hurt. The results came where encouragement and engineering arrived together.
2 min read · Read the story
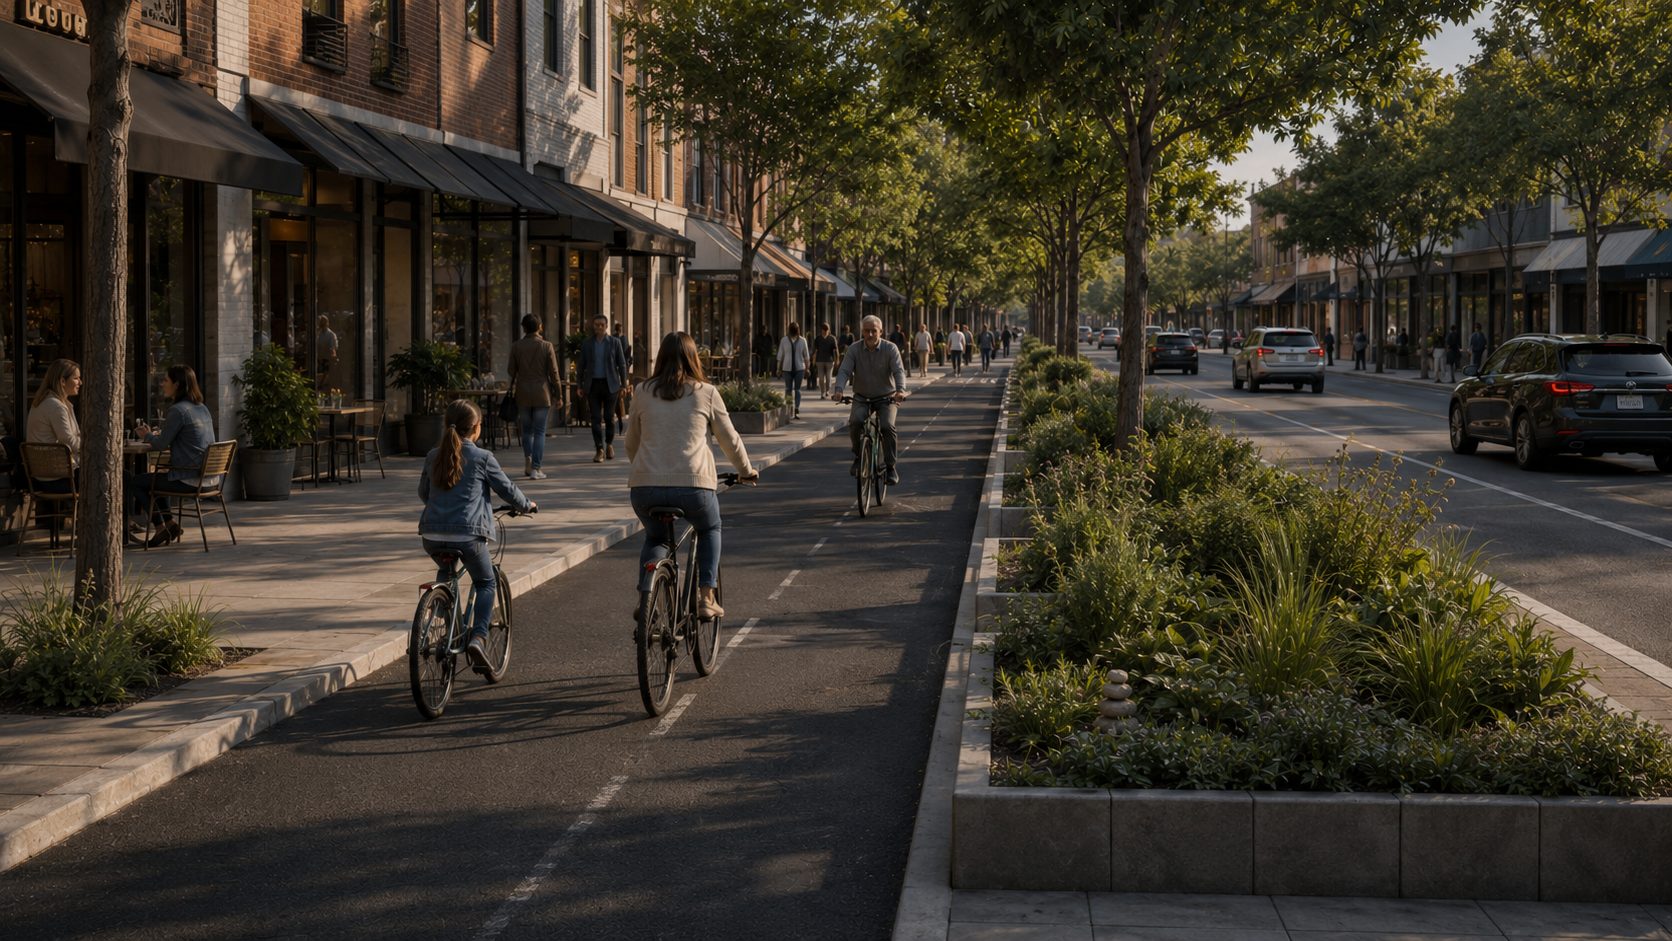
The lane that paint could not build
A 13-year study of 12 US cities found that protected bike lanes made streets safer for everyone, drivers included. Painted lanes did nothing. The difference is physical.
2 min read · Read the story
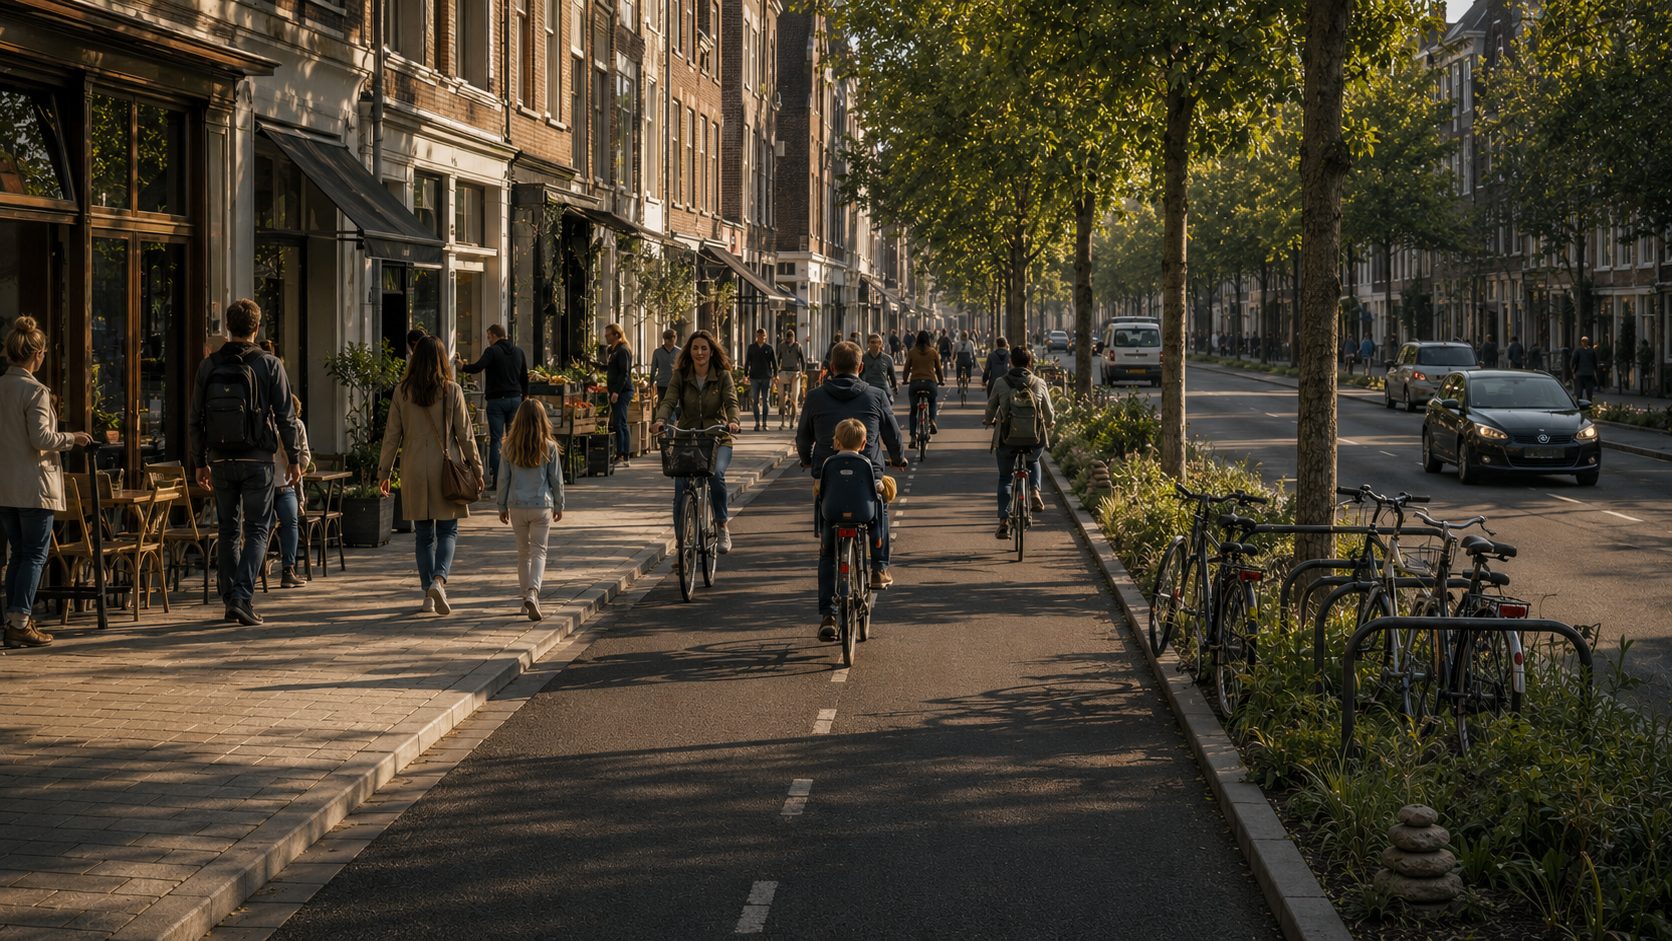
Safer because busier
As more people walk and cycle, the risk to each person falls. The street teaches its drivers what to expect, and what they expect changes how they drive.
2 min read · Read the story
Follow the evidence.
New case stories, practical findings and field notes from behavioral mobility design.