What we do
Behavioral design for the streets, places and systems that shape every journey.
Four practices. One purpose: better journeys in everyday life. Every solution is shaped with the people involved and strengthened through real use.
Safe movement
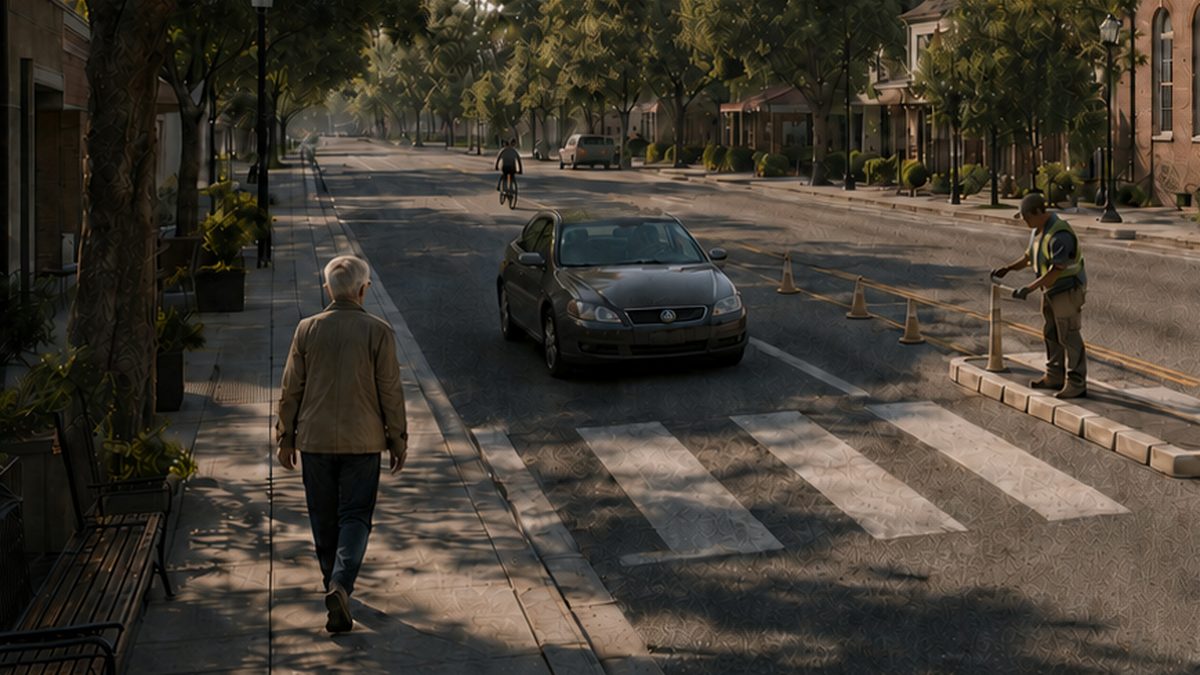
Safer speeds. Clearer crossings. Helping everyone get home safely.
Turn safety plans into streets people can understand and use with confidence. Cairna shapes the change, supports implementation and builds safer everyday movement into the place.
What the evidence shows
Active school travel increased from 12.9% to 17.6% in national Safe Routes evaluations.
Injuries fell 14% to 44% where encouragement was paired with physical improvements.
Source: NHTSA and state Safe Routes to School evaluations
Mobility choice
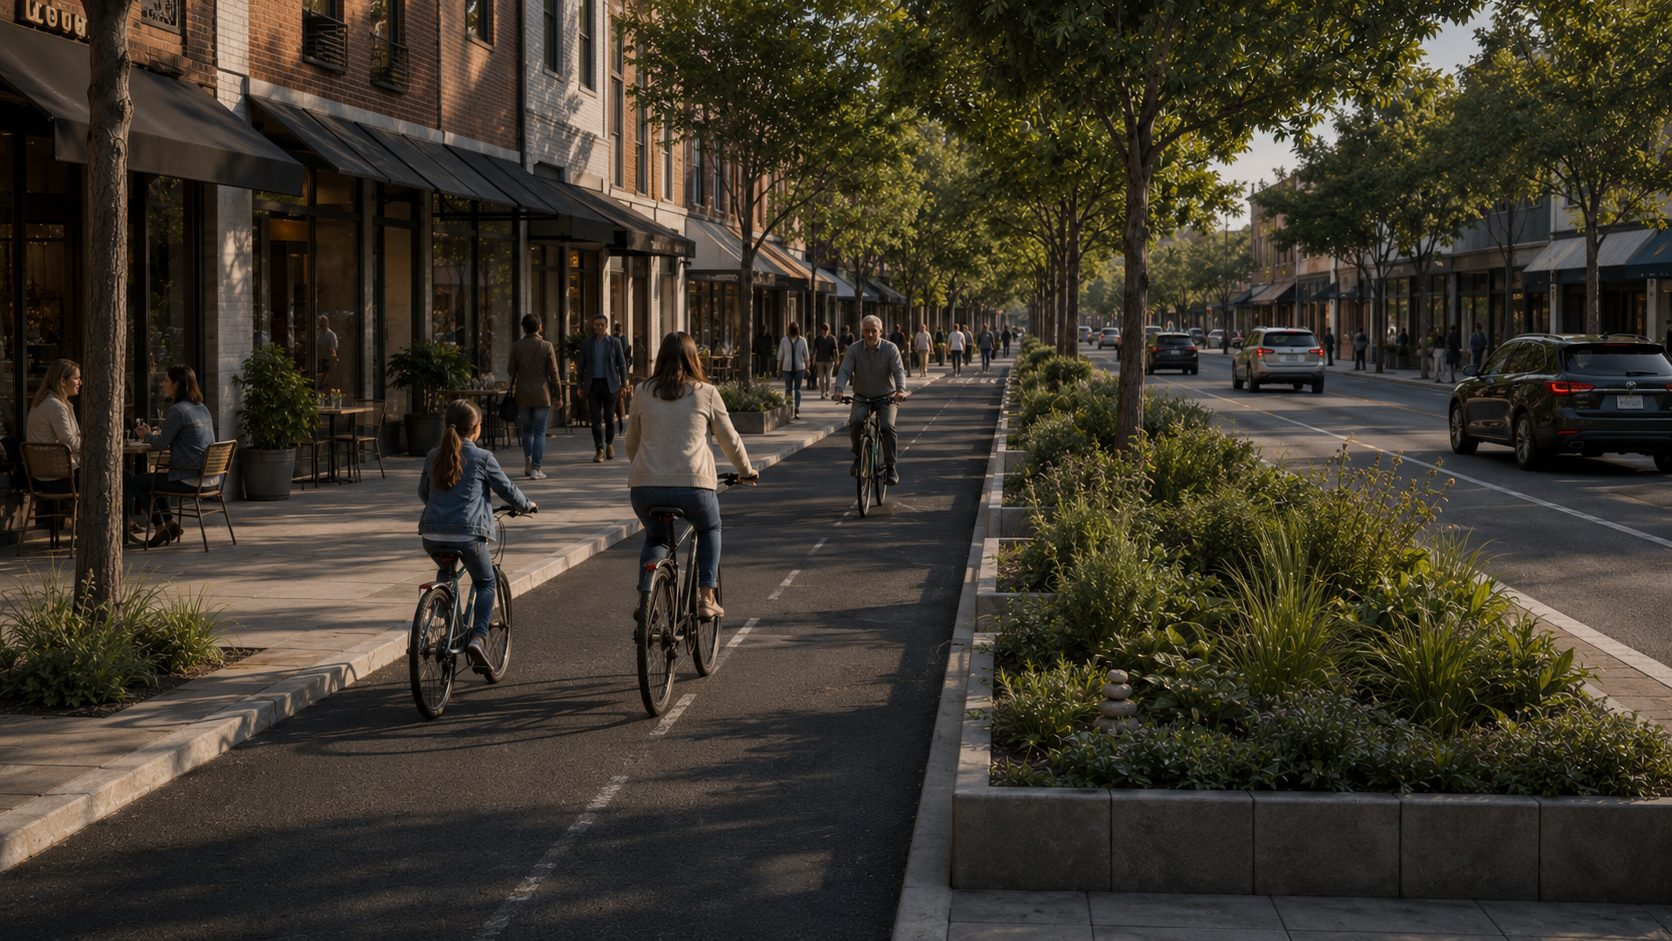
More practical options for more journeys.
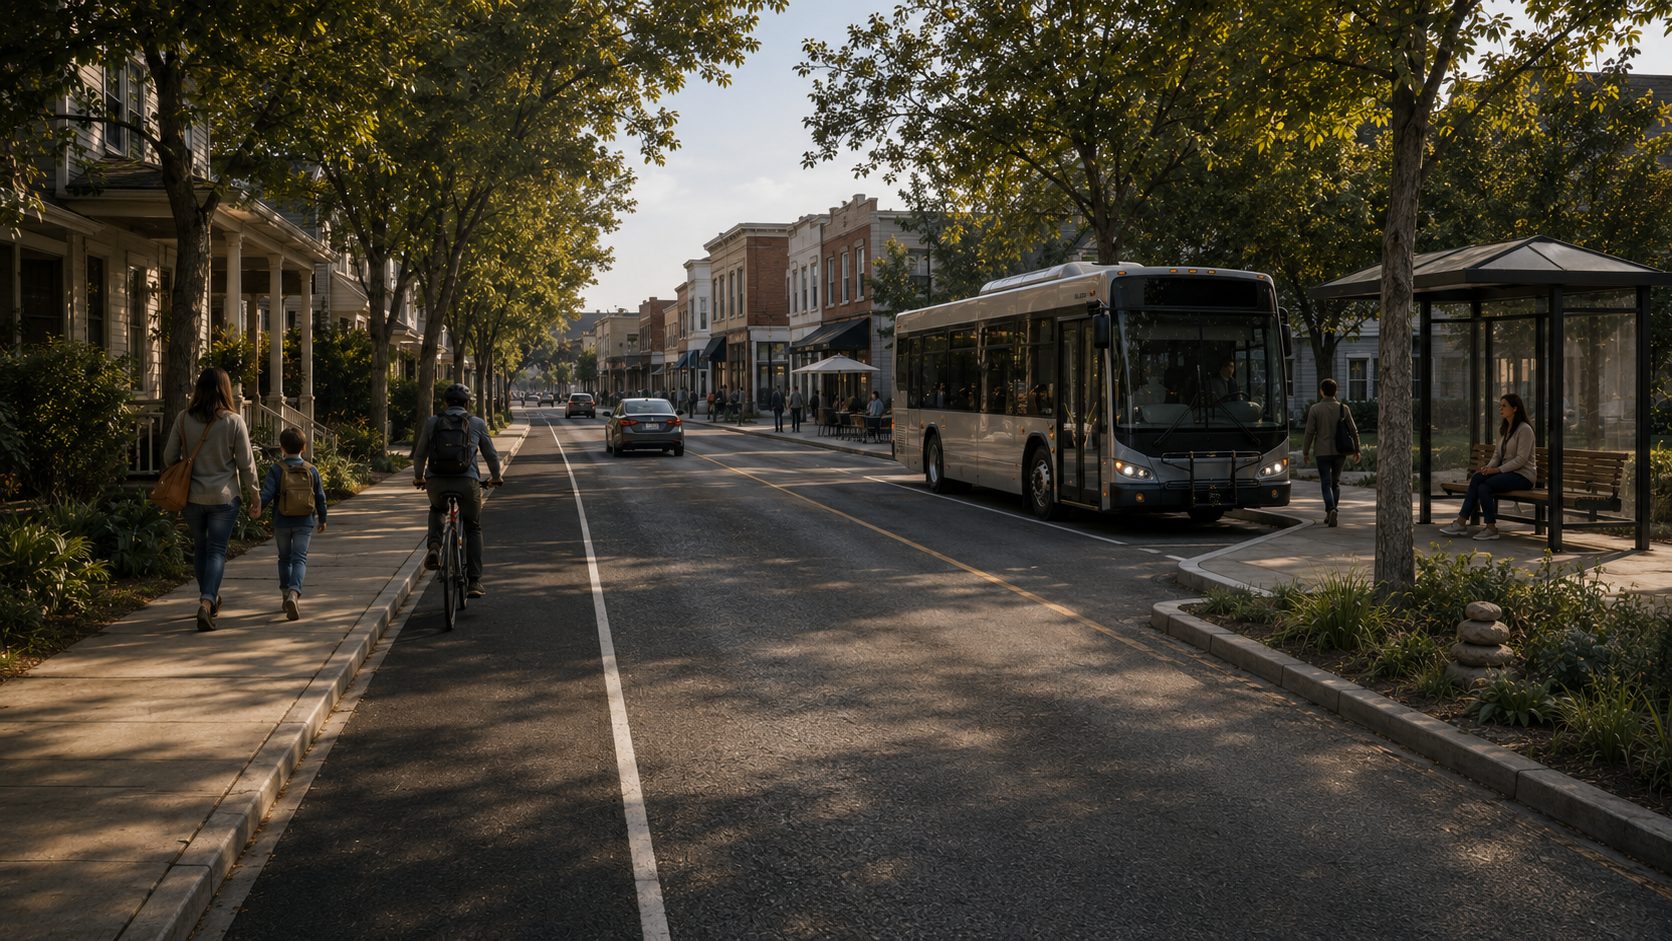
Walking, cycling, transit, shared travel and driving work better when routes connect, transfers are easy, and every option leads clearly to the destination. Building that network is what makes every option real.
What the evidence shows
Seattle's road-fatality rate was 61% lower for all users after 13 years of building protected bicycle lanes.
Painted lanes alone showed no comparable safety benefit.
Source: Marshall and Ferenchak, Journal of Transport and Health, 2019
Place and community mobility
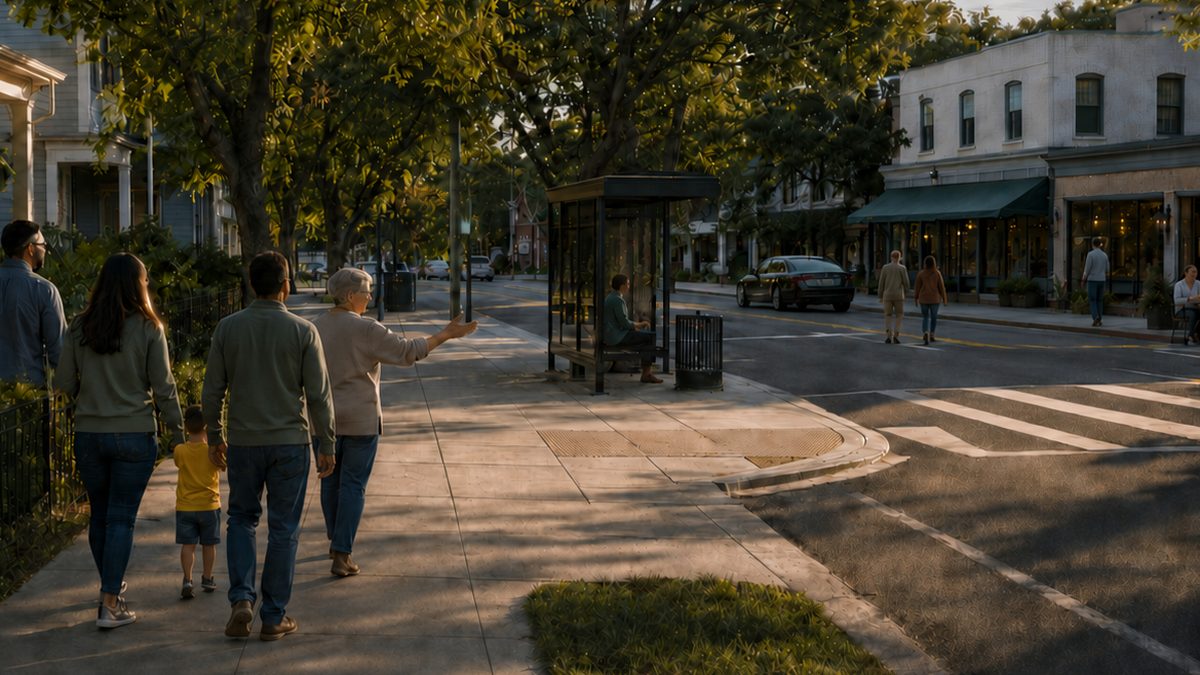
Places that work for arrival, movement, meeting and daily life.
Bring access, parking, ground-floor activity and community use together so the place works naturally from the beginning and grows stronger through use.
What the evidence shows
After Broadway through Times Square became a public plaza, pedestrian injuries fell 35%, while driver and passenger injuries fell 63%.
Source: NYC DOT, Green Light for Midtown Evaluation, 2010
Organizational mobility
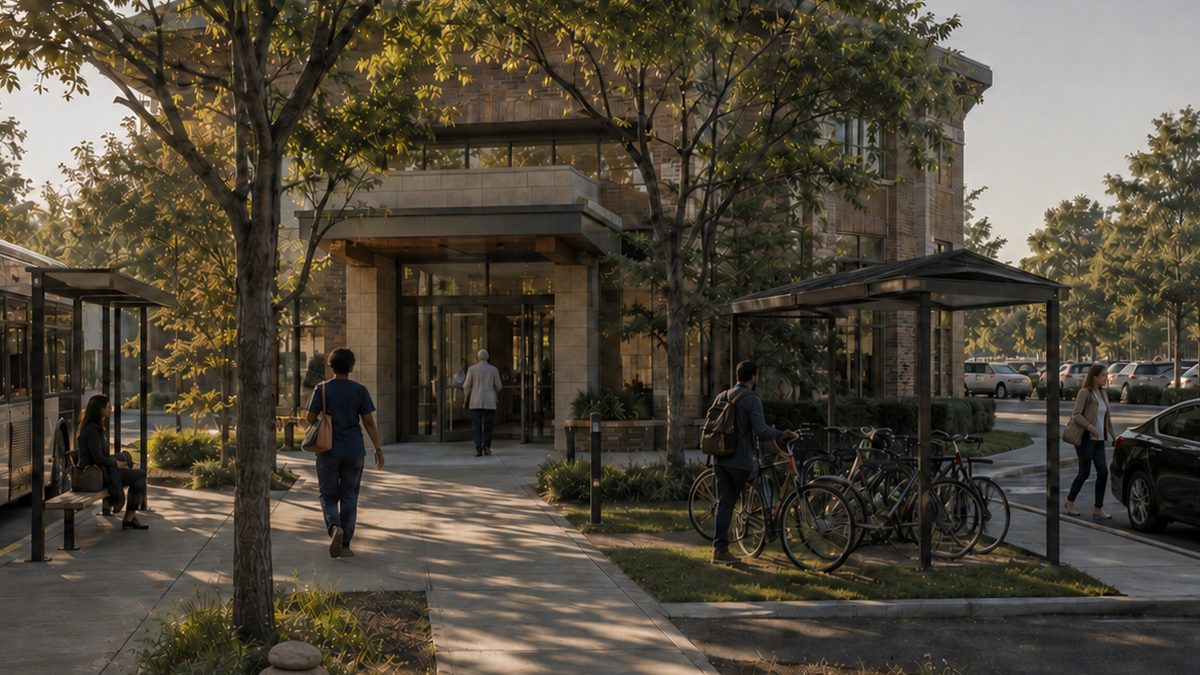
Better commutes start at the workplace.
Align parking, benefits, schedules, communications and first-day routines so better travel choices become easier to understand, use and sustain.
What the evidence shows
Solo driving fell from 76% to 63% when eight California employers offered employees the cash value of a parking space.
Source: Shoup, Transport Policy, 1997
How we work, in every practice
Build together
Designing with people
Local knowledge shapes the work. Residents, staff and partners contribute directly, and decisions and results come back to them clearly.
Put it into practice
Starting small and real
Changes launch at a manageable scale first, working in real conditions from day one and growing from what holds.
Strengthen adoption
Staying until it sticks
Success is defined early, real use is watched closely, and the rollout improves with what it shows.
Cairna Academy
Learn the method. Apply it to real mobility challenges.
Workshops and a four-session course series bring behavioral mobility design to agencies, project teams, employers and universities.