
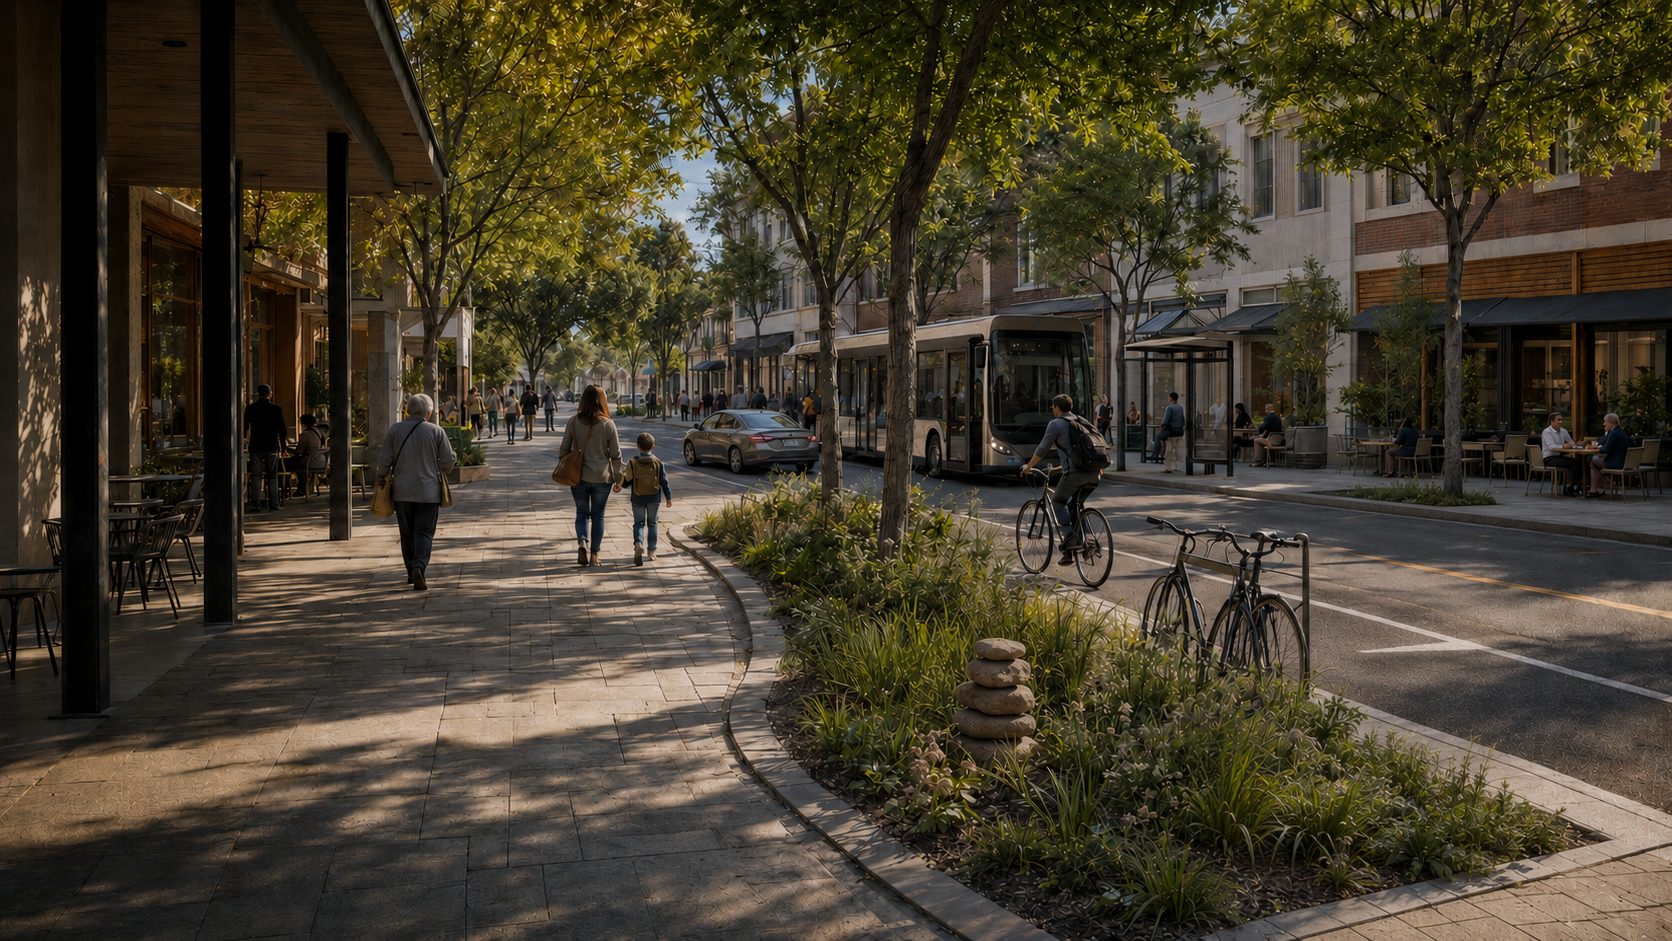
Designing better
ways to move.
Safer trips to school. Easier journeys to work. Main streets full of life.
We bring solutions to life and build everyday adoption.
Infrastructure sets the conditions.
Human behavior shapes the results.
Better communities begin with understanding people. We combine behavioral insight, mobility planning and human-centered design to create safer, more connected communities that reflect how people actually live and move.
Better movement, wherever life happens.
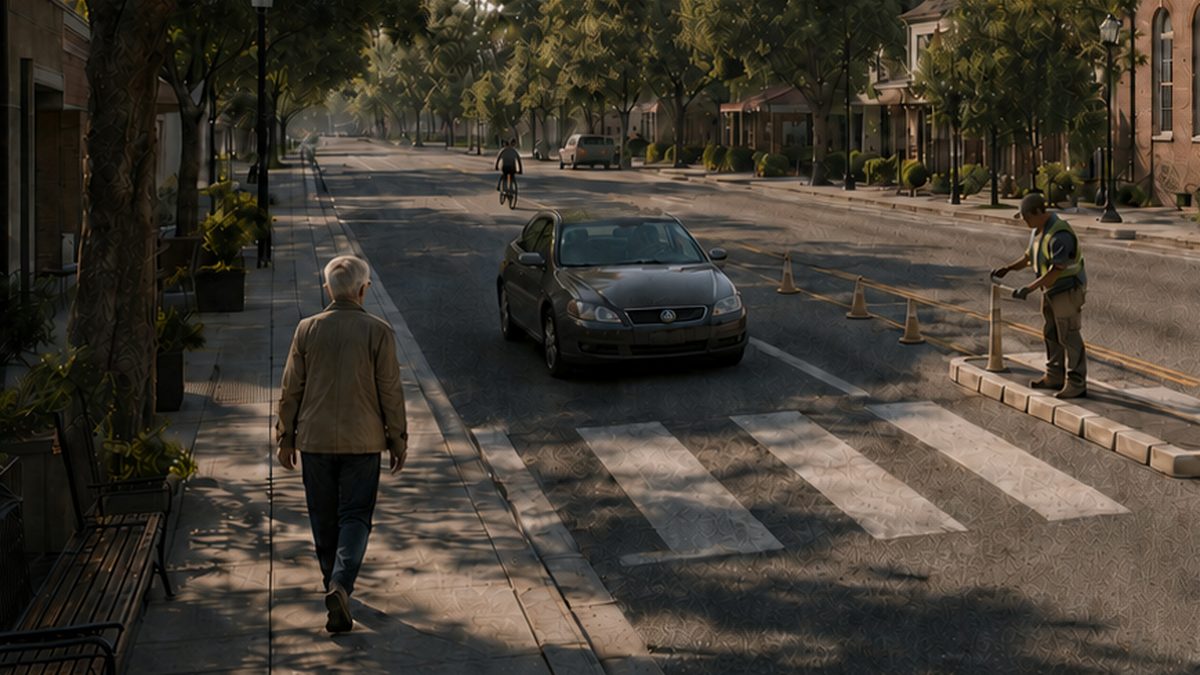
Safe movement
Helping everyone get home safely.
Crossings, speeds and school routes, improved street by street.
Explore safe movement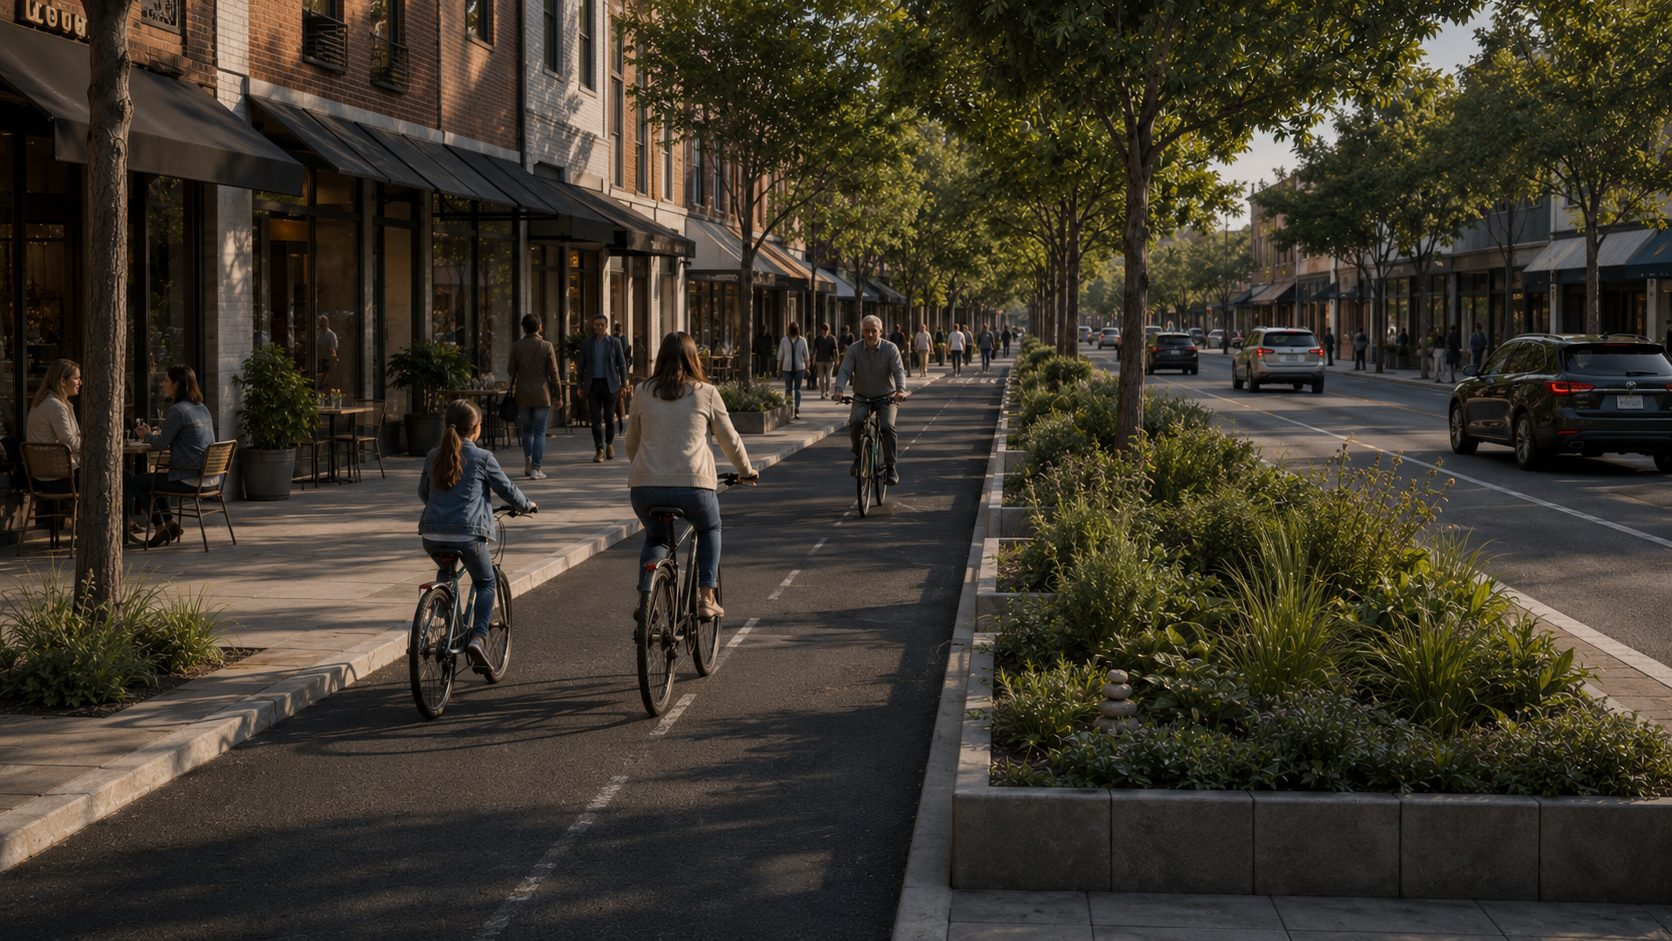
Mobility choice
Creating options for your best journey.
Bike lanes, bus routes and the streets that make every option easy.
Explore mobility choice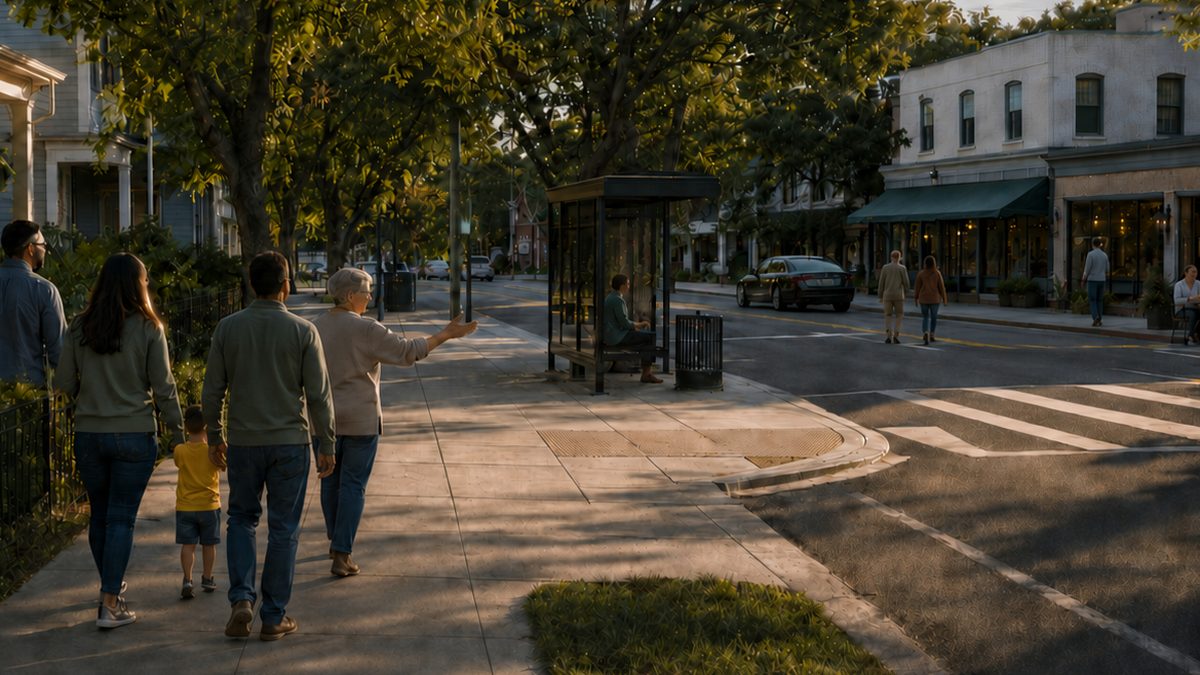
Place and community mobility
Shaping places where people arrive, meet and stay.
New centers and neighborhoods designed around daily life.
Explore places and communities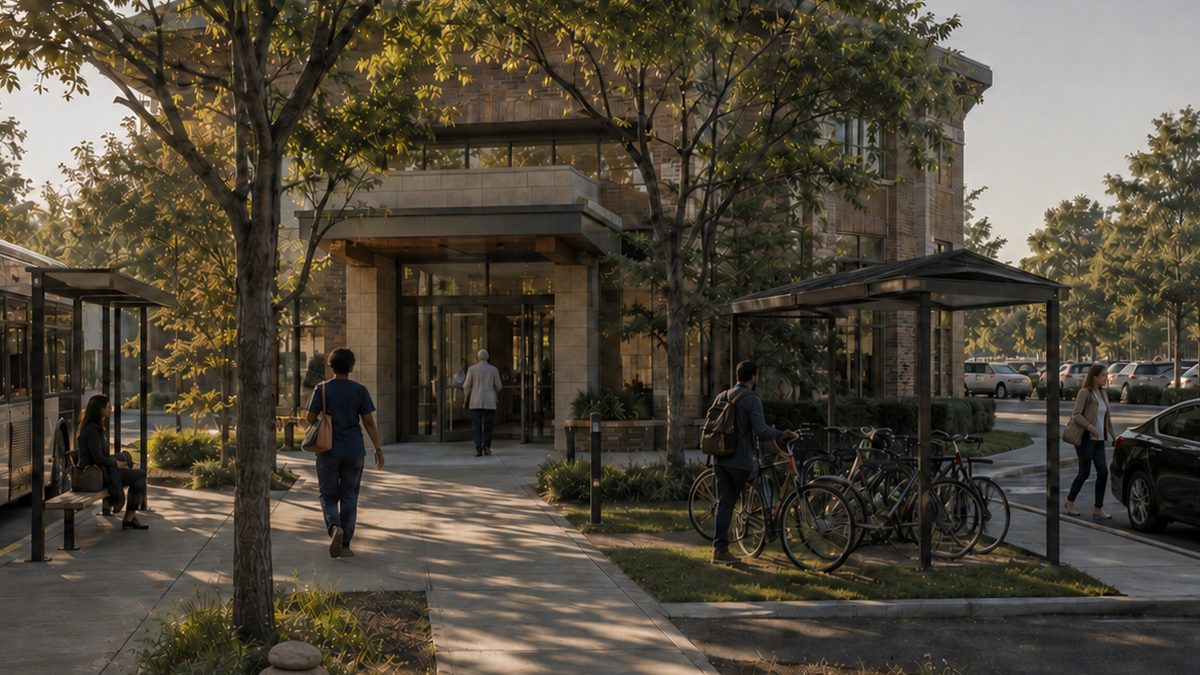
Organizational mobility
Making the daily commute easier.
Parking, schedules and arrivals working together as one journey.
Explore organizational mobilityWorking from the ground up.
Local knowledge. Practical delivery. Changes that hold.
For the people shaping mobility, and everyone moving through it.
Change the conditions, and behavior follows.
80%
Fewer fatal and injury crashes when an intersection becomes a roundabout. The geometry does the asking.
35%
Fewer pedestrian injuries after a famous street became a plaza. Driver injuries fell even further.
76% → 63%
Solo driving, when employees could take cash instead of a parking space. Every option stayed open.
Sources: FHWA and IIHS syntheses · NYC DOT, 2010 · Shoup, 1997. Results vary by place; every claim on this site is graded and sourced.
Three disciplines. One way forward.
Mobility planning, behavioral science and human-centered design, brought together to understand the journey more fully.
No one builds a cairn alone.