
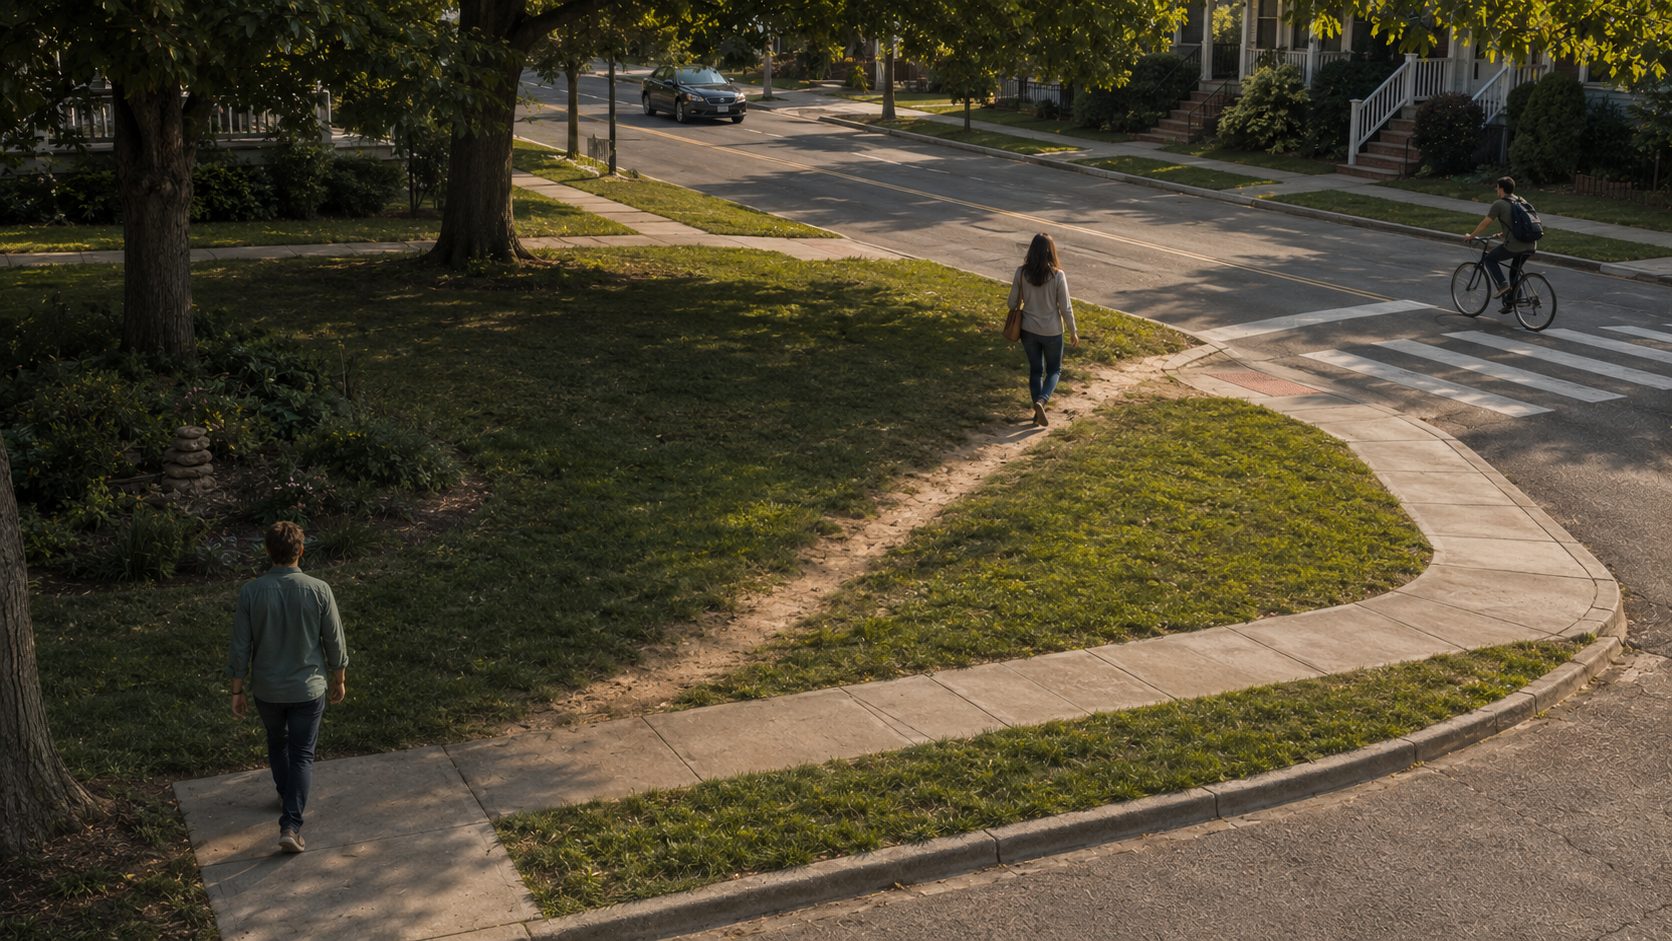
Evidence that helps solutions work.
What works, where the limits are, and how each claim earns its place.
Mobility evidence is wide and uneven. Strong evidence shapes the solution; real use shows how to strengthen it.
What the evidence supports
The strongest evidence supports changes to the environment: safer speeds, clearer crossings and conflicts separated by design.
Information, awareness and education can support change. On their own, they rarely match the results of safer street conditions and well-designed systems.
Awareness alone rarely carries the result. Safer conditions do the heavier work.
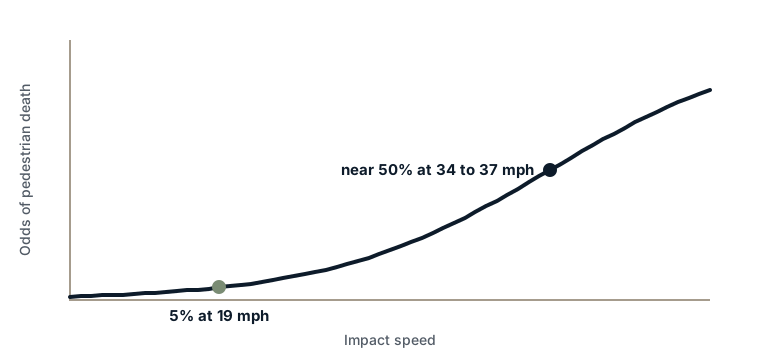
Why speed is the master variable
Every effective intervention traces back to one physical fact: the speed of impact decides whether a person walks away.
What the strongest evidence shows
The measures with the largest, best-quantified effects change the street, so the safe behavior happens without anyone being asked.
78 to 82% fewer fatal and injury crashes when a conventional intersection becomes a roundabout. Curved approaches force low entry speeds without a single sign.
Source: FHWA and IIHS syntheses
78% fewer fatal nighttime pedestrian crashes on lit streets, and about half as many nighttime injury crashes.
Source: FHWA and Elvik meta-analytic syntheses
40 to 65% lower injury odds for riders on curb- or barrier-separated bike tracks. Painted advisory lanes were associated with a 34 percent increase.
Source: Marshall and Ferenchak, 2019; FHWA-HRT-23-078
63% fewer injuries to drivers and passengers after Broadway through Times Square closed to through traffic. Pedestrian injuries fell 35 percent.
Source: NYC DOT, Green Light for Midtown Evaluation, 2010
How every claim is graded
Strong
Ready for public use.
Rigorous evidence, relevant settings and low risk of bias.
Use with care
Useful, with limits named.
Credible evidence with constraints in design, setting, sample or transferability.
Limited evidence
Tracked, not used for material claims.
Evidence still too limited for a public recommendation.
Grades reflect methodology, consistency, relevance and uncertainty. Every material claim carries its source, grade and limits.
The publisher's name never determines the grade.
Claim
Offering employees the cash value of a parking space reduced solo driving from 76 percent to 63 percent across eight California employers.
The safety evidence review
A global review of the interventions that most effectively reduce pedestrian and cyclist deaths.
Publication in preparation.
Insights
Practical ideas, emerging findings and new questions, each linked to the evidence behind it. Read Insights
Ask for the source behind any claim on this site.
Atlanta · Luxembourg